
Data analytics is a cornerstone for decision-making, strategic planning, and target marketing in business. There’s also an ever-growing demand for data analytics in the accounting profession—so much so that it will become part of the updated CPA exam in 2024.
Business students should be exposed to data analytics early, and often, so they develop a skill set vital to their careers. Principles of Accounting courses are ideal for introducing the topic of data analytics. Students are required to take these classes at the beginning of most business programs, and accounting by nature is a vast collection of content just waiting to be analyzed.
The prospect of including data analytics in Principles classes, however, is justifiably daunting for Accounting instructors. In her blog post on this subject, Kristen Quinn voices two common faculty reactions:
1. “I don’t have the time to spend teaching students the fundamentals of data analytics in my course.”
2. “I’m not an expert on data analytics—how do I begin with creating appropriate data analytics assignments?”
Well said.
Data Analytics Skill Builders—a solution for Introductory Accounting students (and faculty)
I’m excited to be implementing the new Data Analytics Skill Builders (DASB) from Cengage. They’re interactive activities that specifically target introductory Accounting students. DASBs are directly tied to textbook topics and examples. They can be used to teach or reinforce accounting content covered in the course.
DASBs are completed in CNOWv2 using its Excel Online problem type, making them available to all students on all operating systems. So, an added benefit is that students improve their proficiency with Excel, which is also a highly desired business skill!
The good news is:
- Faculty don’t need to teach data analytics or Excel, since multiple resources* are available to guide students in completing DASBs.
- Cengage has 40 DASBs that cover a wide array of financial and managerial accounting topics – so there’s no need to create our own assignments.
Well done.
* Resources
- A 13-page primer document describes the basics of Excel and formulas, lists and provides examples of functions relevant to these activities, and details the process of creating pivot tables.
- Show Me How Videos cover pivot tables and filtering.
- Check My Work feedback evaluates attempted answer cells, and hints provide useful prompts.
- Post Submission feedback details pivot table instructions and related explanations, and mouseovers provide rejoinders for answers, even if entries are correct.
Data Analytics Skill Builders—what they look like
Each activity briefly describes a scenario related to an accounting exercise or topic to create context.
Students open an Excel worksheet with a realistic data set related to the accounting topic. Column headings each describe the information recorded or requested (if blank). Each row represents an individual record—one borrower, customer, sale, loan, asset, etc. There are hundreds of records, so students use Excel tools to extract specific information they are asked to find. Data sets are algorithmically generated, so each student has a different version unless instructors choose otherwise.
There is a consistent look and feel among the DASB activities. Students first complete the Excel data sheet by entering formulas and functions in the blank columns (requirements). They then answer four quantitative questions about select elements of the full data set. Finally, they respond to one critical thinking multiple-choice question related to the topic.
Let me take you on a quick tour of one of the activities. The example that follows shows data for four of the 300 records from the DASB on short-term notes.
Requirements
STEP 1: Student opens the data sheet provided and notes that two columns contain no entries.
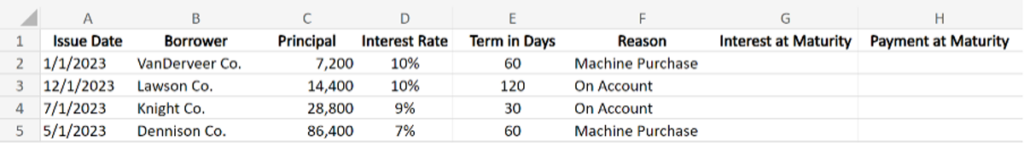
Students start by entering formulas in the first row of the data set to solve accounting-related questions, which teaches and reinforces key concepts. These calculations are typically the questions that would be asked as word problems in a textbook…. just in a different format.
STEP 2: Student enters formulas to solve for missing amounts for the first record in the data set.
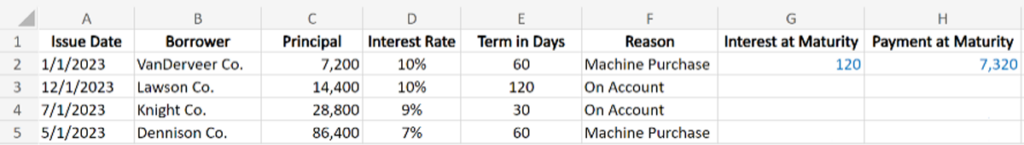
It requires some critical thinking to create formulas that result in correct answers—beyond what it takes to just type static numbers into a calculator. What I like is that the formulas are an archive of a student’s thought processes They can be used as quick references later on when the student is wondering “How did I get that number?”
As a best practice, I allow students to check their work (and correct their formulas, if necessary) after they solve for the amounts in the first row, so they don’t proceed with an incorrect answer. All subsequent questions depend upon the answers in the first record.
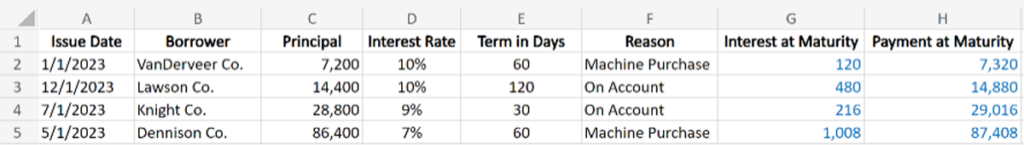
Once the accounting content questions have been answered in the first row, those formulas are copied down to all other records to complete the data set. This may involve correctly applying relative and absolute references in Excel.
STEP 3: Student copies entries for the first record down to all other records.
Quantitative questions
Now comes the data analytics! Students are asked four questions related to the data set they completed in steps 1 to 3. They use Excel pivot tables and functions to extract relevant information and insights from the data set to answer targeted questions.
STEP 4: Student creates basic pivot tables to “slice and dice” and filter and sort the large data set.
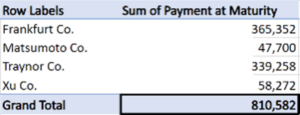
What is the amount Company A will collect from Frankfurt Co., Matsumoto Co., Traynor Co., and Xu Co. combined when these customers pay their 2023 loans in full?
Questions become increasingly analytical and may ask for comparisons, trends, changes over time, ratios, decisions, choices, etc.
Qualitative multiple-choice question
Finally, students feel proud and accomplished when they arrive at a correct numerical answer using formulas, functions, and pivot tables. But do they actually know what the result means? Is it good or bad? Better or worse? Acceptable or below standard?
STEP 5: Each DASB includes a qualitative multiple-choice question to assess students’ critical thinking.
How’s it going so far?
So far, the experience with the new DASBs has been positive! Students catch on quickly to the process, and they seem to enjoy the hands-on, drag-and-drop interface used to create the pivot tables. They are really using the resources—the primer and videos—to learn on their own. Plus, their formulas result in correct answers to accounting and data set questions!
My sense is that Business students who complete even a handful of these activities will not only learn some accounting, but will also build up their Excel, data analytics, and critical thinking skills.
Want to learn more about Data Analytics Skill Builder activities for Introductory Accounting classes? You can reach out to your rep to get more information.

Written by Christine Jonick, a Professor of Accounting at the University of North Georgia.
You can watch the recording and access the PowerPoint from the Continuing Professional Education Webinar for Accounting and Tax Instructors that I hosted in Fall 2023. The session includes a demonstration of how students access a DASB activity, enter calculations to complete a large data set, and create pivot tables to answer targeted questions about the data.